


Analysis
Impact analysis
What do the figures show before and after a change? We compare up to five metrics and review other influences that limit the conclusions.
Which events does your tracking actually count? We check one analytics property for gaps and conflicting figures.
Your enquiry is non-binding. An order is created only when you accept our quotation .
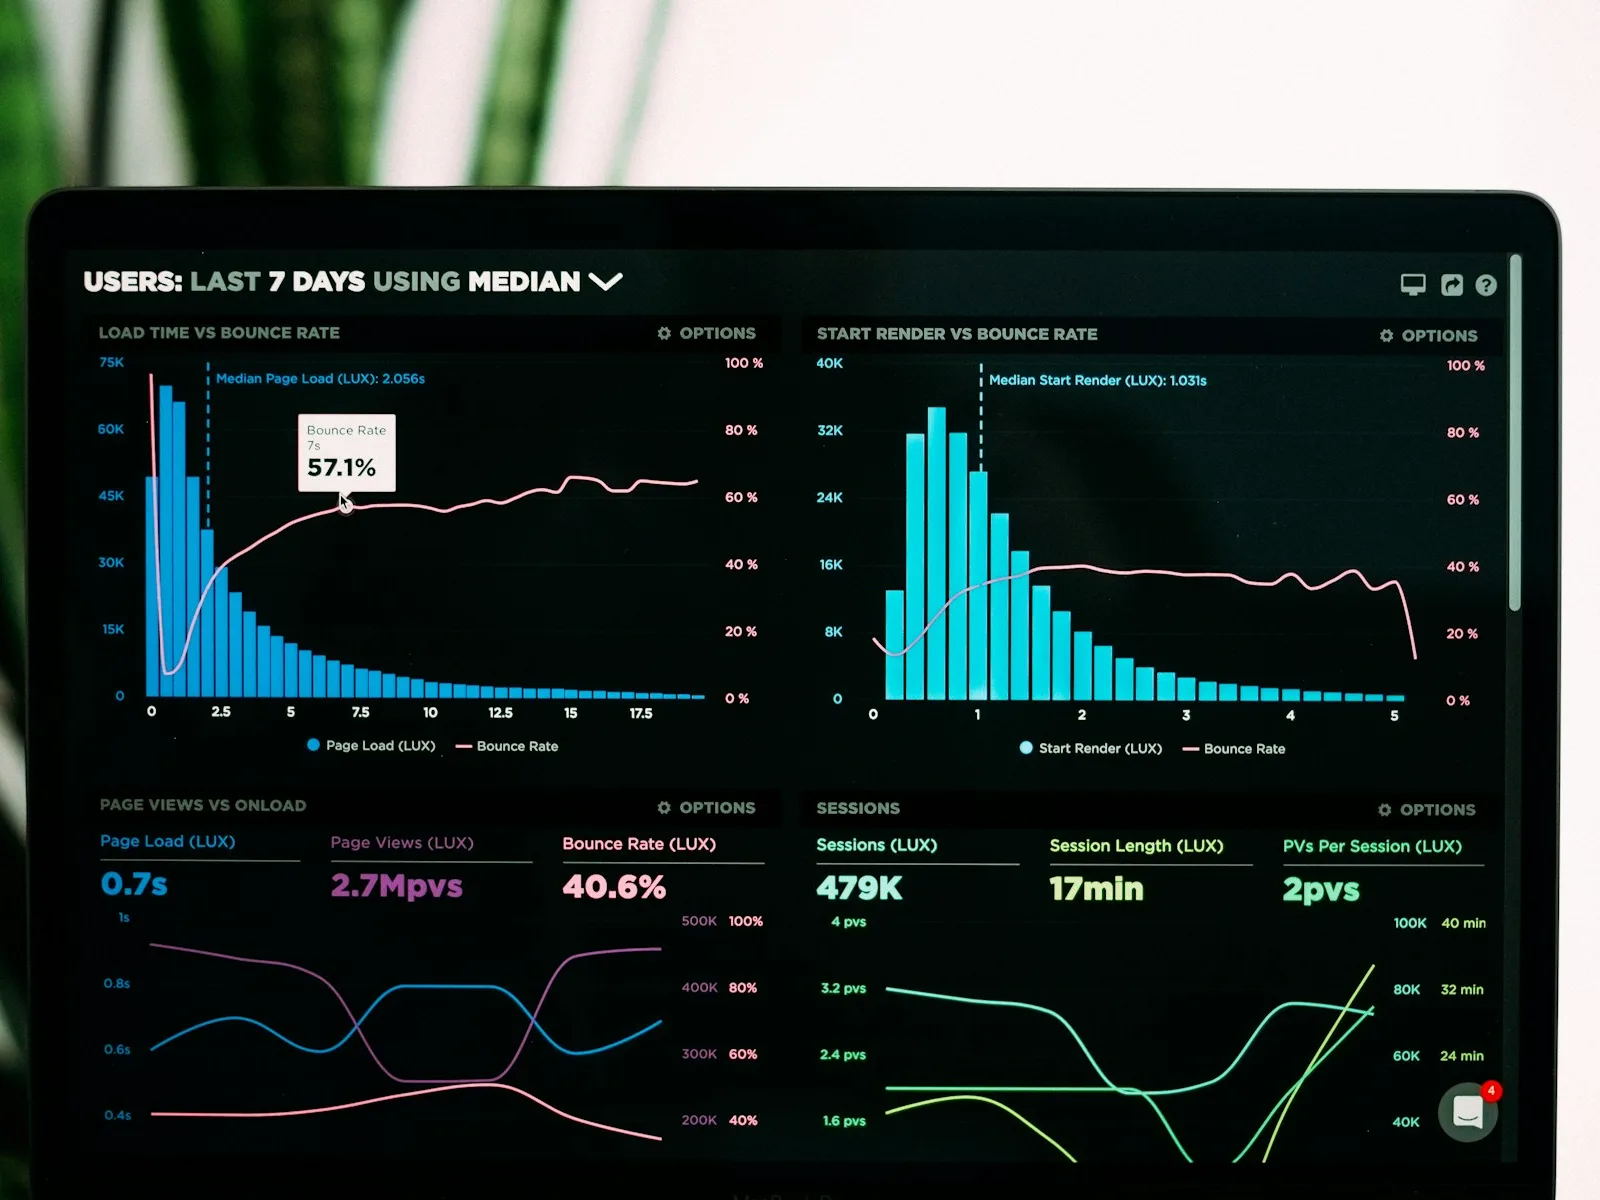
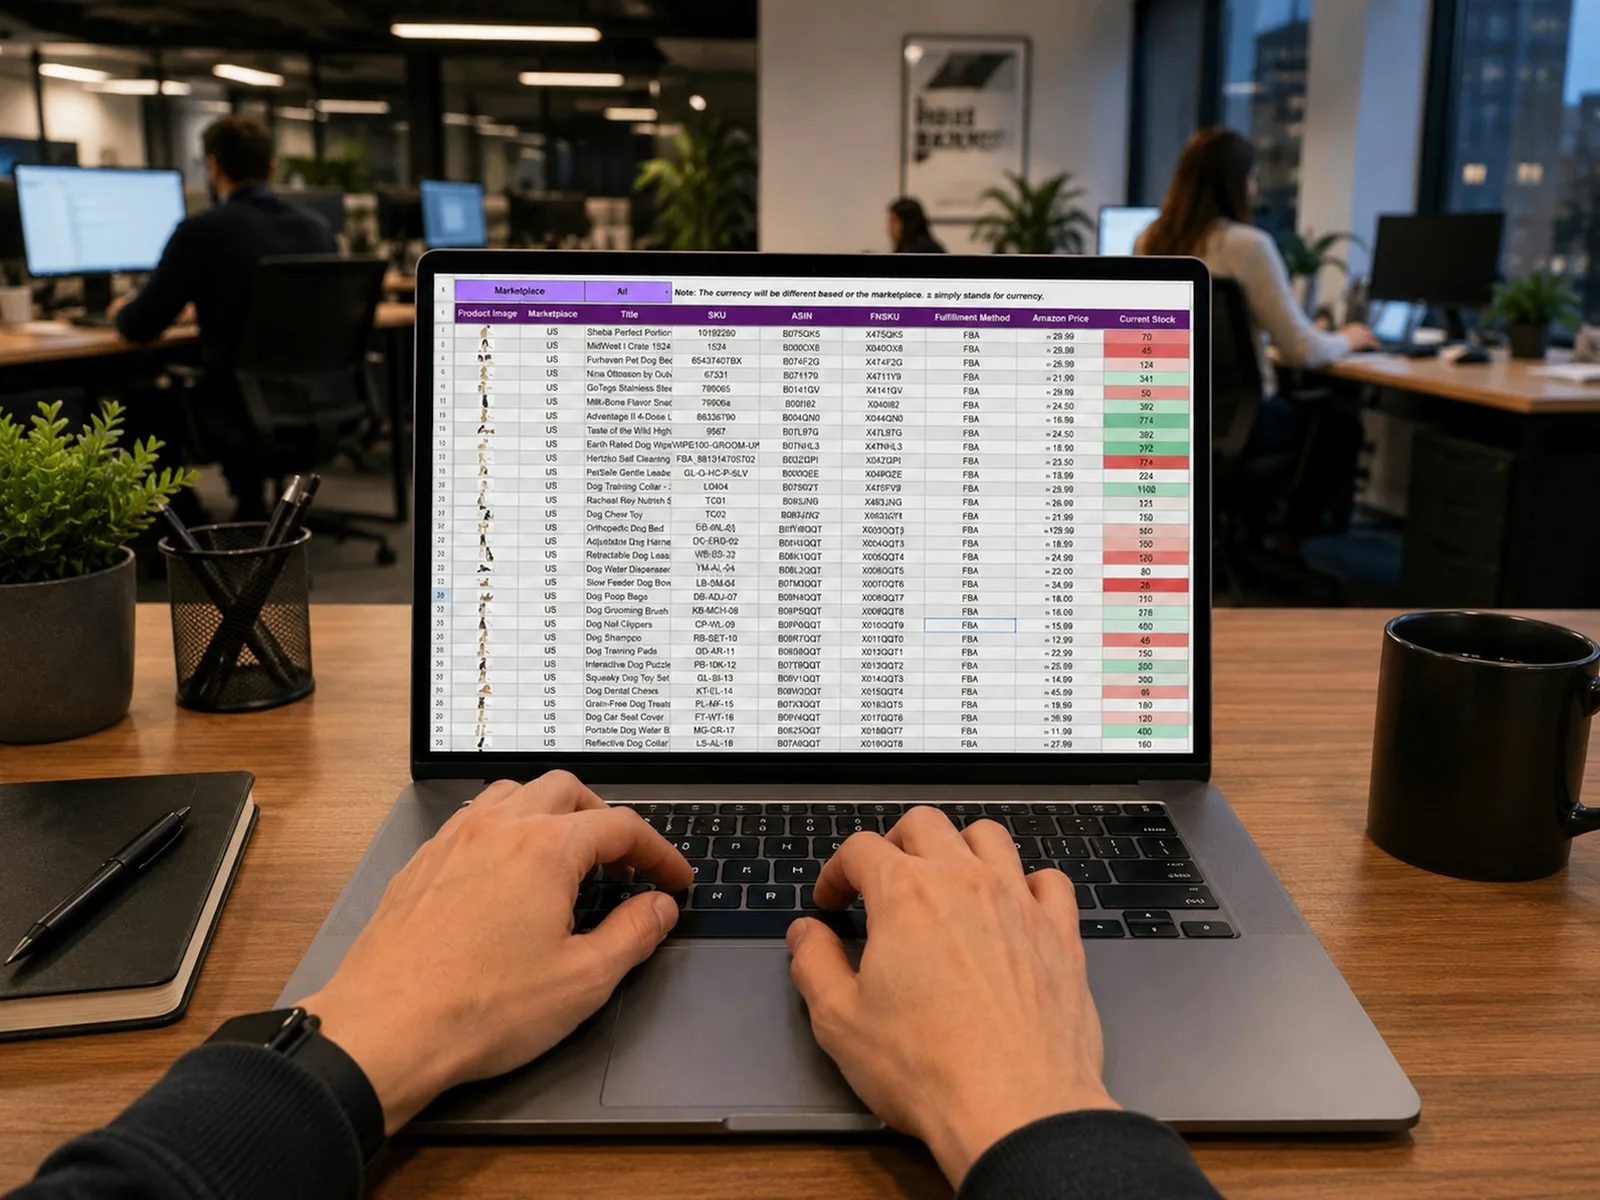

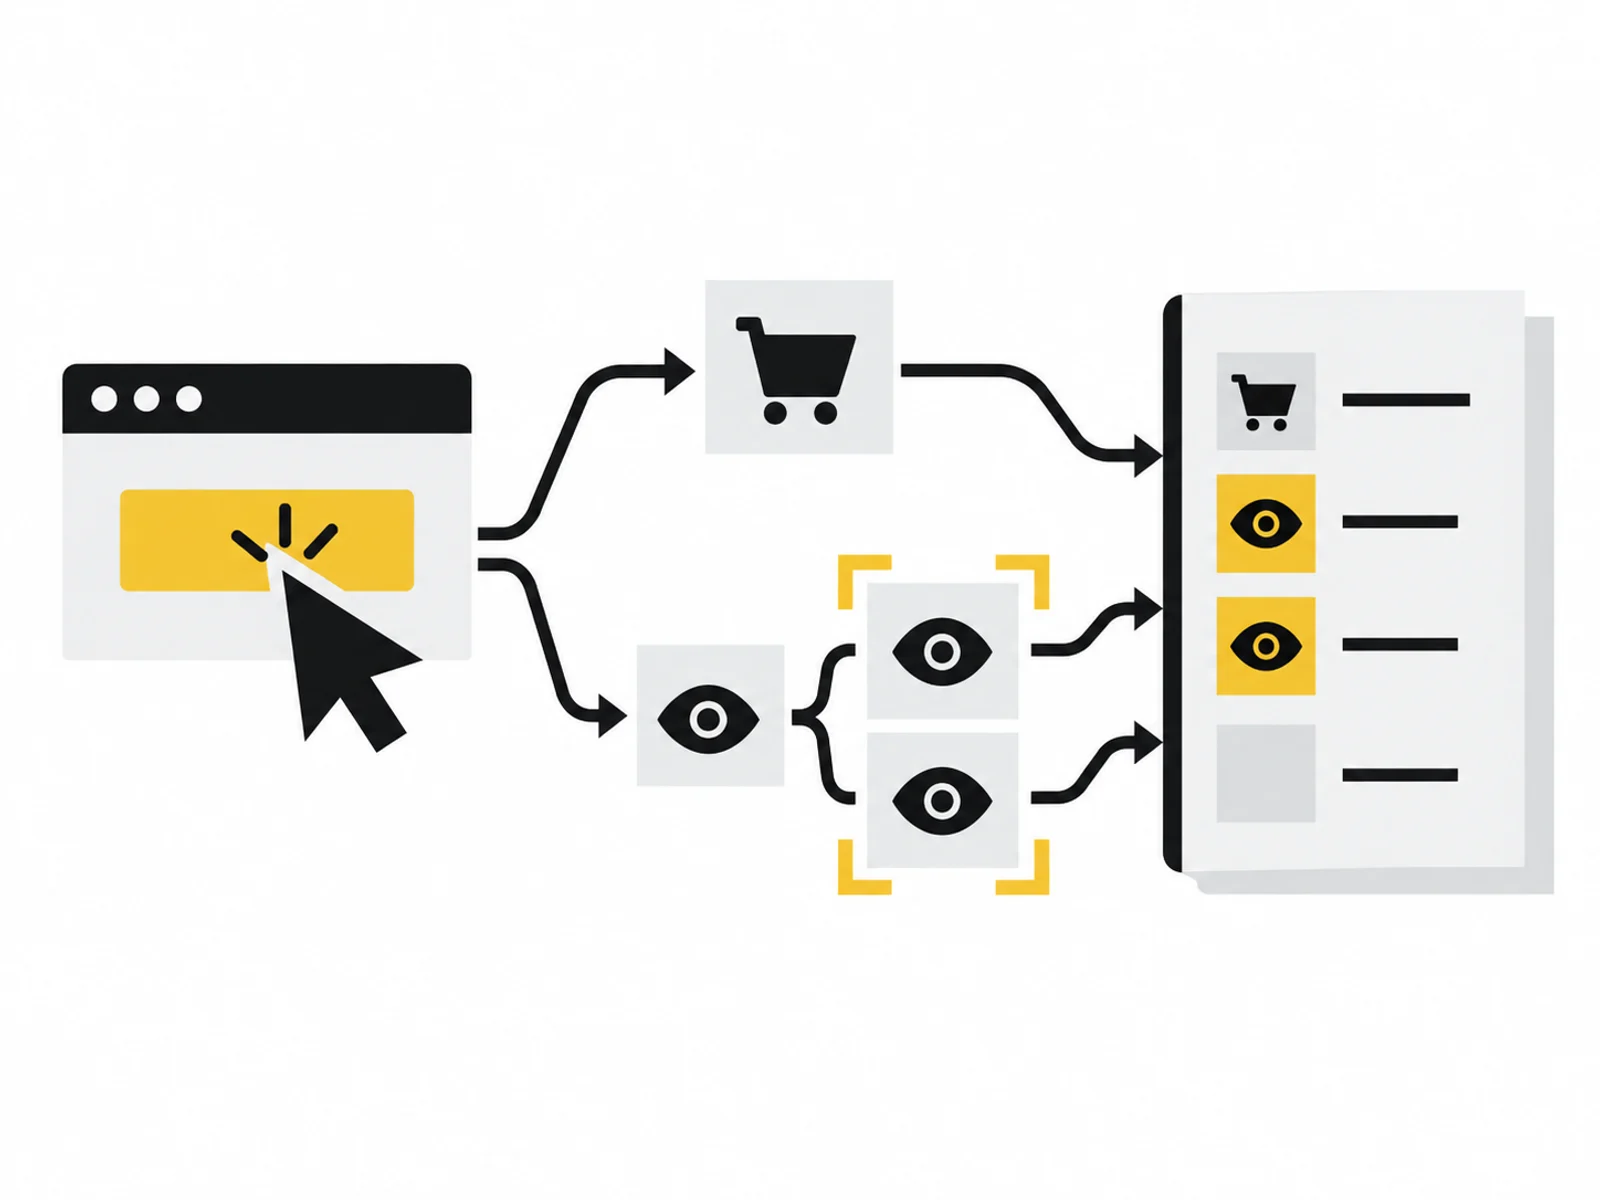


Image 1 of 4
Your shop reports more orders than Matomo or GA4. We check whether the systems count the same processes, whether events fire twice and where measurement has gaps.
We examine one Matomo or GA4 measurement environment and up to five agreed key events. An event is a recorded action, such as submitting a form. For each event, we document its trigger and what its count means.
A property is the separate data area for a website or application in your analytics tool. We first define the events and period for the review. We then examine available settings and documents: what triggers the event? Can the same process count several times? Do labels match what actually happens?
You receive a review log with known gaps and a task list. Your team can see which measurement points need correction or further investigation. The check does not repair tracking or legally assess consent management.
Your shop counts more orders than Matomo. We first compare the period, filters and counting method. Cancellations or missing consent may explain the difference.
The enquiry curve falls after a relaunch. We check whether enquiries changed or the event has since been triggered elsewhere. Missing history is recorded.
Marketing treats clicking ‘Send’ as a lead, while sales counts only a received enquiry. We clarify what the agreed events count and which decisions they can inform.
We define the property, period and key events to review. An understandable event definition matters more than the number of reports. You describe the decision the data should inform and known changes during the period.
We review event definitions, settings and supplied data. For anomalies, we record the relevant conditions. Where history or documentation is missing, we state the open question rather than guessing a cause.
You receive a list of conclusions supported by the data, open questions and next verification steps. Tracking repair and technical acceptance are excluded.

Mark in your reports which metrics have been clarified and which still have measurement gaps. A later comparison requires a period using the same definition. The list of unresolved measurement points helps development prepare a repair.
If you want to assess an implemented change using data, the impact analysis fits. For a shop purchase journey, the shop diagnosis combines the interface and existing data. Before combining services, we define their respective questions.
Which decision depends on the figures? Note the metric, analytics tool and known changes during the period. We clarify these together after receiving your enquiry.
You do not need to provide credentials or full exports yet. We first agree which data is needed and how it can be supplied.
What is included, what do you need and what happens after your enquiry?
The process in detail →The package covers one agreed Matomo or GA4 property. We define in advance which events and documents will be considered. A simultaneous complete reconciliation of several analytics systems is not automatically covered.
No. You receive documented findings and tasks for correction or further review. Your existing development team can plan the repair. Implementation can be scoped and quoted separately if needed.
No. Missing consent, technical blocks and different definitions may continue to limit collection. The check shows these limitations for the events examined; it does not certify completeness.
No. A technical issue around consent may be relevant measurement context. It does not provide legal approval of your consent interface or data processing. A complete consent or legal audit is expressly excluded from this package.
Here, a property is the defined data environment covered by the check. Multiple websites, accounts or data sources may have different boundaries. We therefore agree the environment and events first, rather than assuming unlimited data access.
No. Measurement gaps and conflicting events cannot be converted into lost revenue without further assumptions. The check describes data quality and limitations. Economic scenarios require your own inputs and remain separate from measured results.
The work window is confirmed in writing before commissioning. Work starts once all required materials are available.
An existing analytics property containing data An agreed period and definitions of your key events Aggregated exports or authorised read access only after commissioning; no credentials in the enquiry form Credentials must not be included in the enquiry. Details are agreed only after written commissioning.
One written follow-up round is included. The service scope lists the analyses, designs or technical changes covered by the package. We agree additional work with you before it begins.
Does your report count a click or a saved enquiry? Align triggers, reporting periods and tracking gaps with the shop system.
Read the guide ↗What do the figures show before and after a change? We compare up to five metrics and review other influences that limit the conclusions.

We examine one purchase journey and the available analytics data. The report sets out findings, open questions and the next tests.