For online shops, websites and digital products
USA · USD
Analysis / Analytics · Product Design

Impact analysis

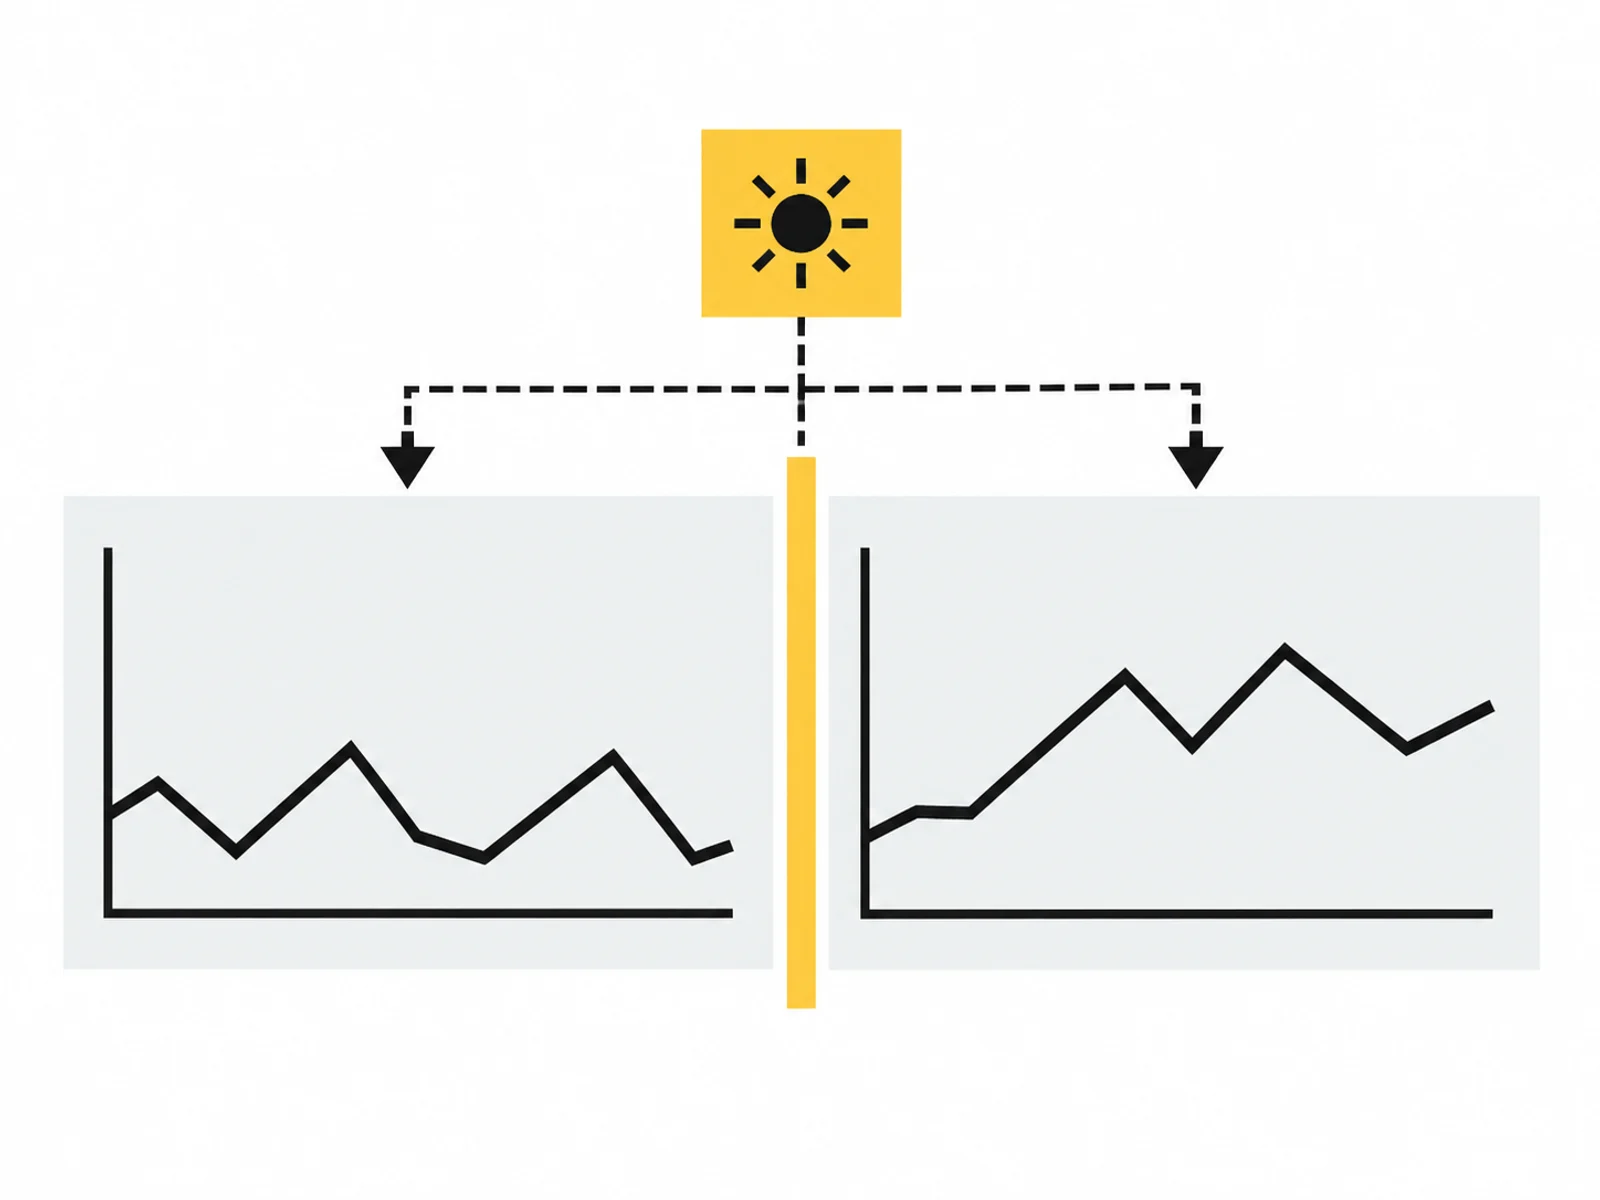
What do the figures show before and after a change? We compare up to five metrics and review other influences that limit the conclusions.

US$999.00
Total price · one-off
VAT-exempt under section 19 of the German VAT Act
Add to selectionOne of each service per project. No automatic commitment.
SaveCompare
Does this service fit your project? Ask us ↗
  • One documented change to one project
  • One analytics property or agreed data export
  • Up to five metrics and two comparison periods of no more than eight weeks each

Your enquiry is non-binding. An order is created only when you accept our quotation .

Service scope

Your result

  • Comparison report with data quality, known confounding factors and open questions
  • Recommendation for the next investigation based on available data

Included

  • One documented change to one project
  • One analytics property or agreed data export
  • Up to five metrics and two comparison periods of no more than eight weeks each
  • Data-quality review and documentation of identifiable confounding factors
  • Comparison report, recommendation for the next test and one written follow-up round

Excluded

  • No proof of causality from a before-and-after comparison alone
  • No tracking repair or A/B-test implementation
  • No revenue guarantee, success estimate with missing data or new full UX audit
  • Review already included in a quarterly review for the same period is not charged twice

Which projects does this service suit?

Suitable if …

  • You want to interpret existing data after an implemented change.
  • Comparison can be limited to a few metrics and named periods.

Not suitable if …

  • A usable baseline or comparable measurement is missing.
  • You expect certain proof that the examined change alone caused an effect.
Possible overlaps with: Quarterly review, Analytics data check. If you enquire about these services for the same project, we check for duplicated work before commissioning. Your selection also shows a notice.
What this covers

Did our last website change actually improve anything?

Orders have increased since the new product page. A campaign is also running. We compare available data before and after the change and assess which conclusions it supports.

Impact analysis examines one documented change, up to five agreed metrics and two comparison periods of no more than eight weeks each. It uses one analytics property or agreed export. A usable baseline and change date must be available.

Separate measured change from its cause

We first check whether the same events and periods are being compared. We also record measurement changes or a campaign running at the same time. Temporal coincidence is not hastily presented as the effect of the change.

The report presents the comparison, data quality and open questions, leading to a recommendation for the next investigation. A controlled test can provide a different basis from time comparison alone; its planning and technical setup are excluded. If suitable data is missing, no impact result is invented.

Does this sound familiar?

Metrics change after a redesign

The order rate rises after redesign, while a discount campaign also ran. We compare the agreed periods and document these influences before attributing the difference to design.

The team debates success without a shared definition

The team treats more clicks as success while received enquiries stay unchanged. Before analysis, we define up to five metrics addressing the question examined.

The next investigation needs a reason

The figures show a difference but do not yet explain its cause. The report identifies the open question and recommends a next test to investigate it more specifically.

How we approach it.

  1. Define the change and comparison

    We record the change, date and metrics to review. We then choose two comparison periods with measurement definitions and conditions that align as closely as possible.

  2. Check data quality and context

    We assess whether data can answer the question and record identifiable confounding factors. Gaps remain visible; we do not fill them with apparently precise figures.

  3. State results and the next investigation

    The report shows observed differences and explains what cannot be inferred. It recommends a next question to test. A/B-test setup, tracking repair and implementation are excluded.

Hands arranging design cards and yellow notes on a white table.

After handover

Include the comparison and its limitations in planning. Rising click counts justify a different next step from more completed orders. Where several things changed together, the suspected cause needs further investigation.

If the measurement baseline itself is unclear, an analytics data check may be useful first. A quarterly review considers an existing baseline in a recurring project context. Where the same period is already examined there, included checks are not charged again as impact analysis.

After your enquiry

What we clarify next.

Ask about this service ↗

Which decision depends on the figures? Note the metric, analytics tool and known changes during the period. We clarify these together after receiving your enquiry.

You do not need to provide credentials or full exports yet. We first agree which data is needed and how it can be supplied.

Terms used in this service

What does that mean?

Confounding factor
Another circumstance affecting a metric, such as a simultaneous discount campaign. It must be considered before attributing a difference to one change.
Causality
A cause-and-effect relationship. A metric rising after a rebuild does not alone establish that the rebuild caused it; other influences may be involved.
Data export
A supplied selection of measurement data. To analyse it, we need the period and definitions of the included metrics and events.
Before your enquiry

Questions about the offer.

What is included, what do you need and what happens after your enquiry?

The process in detail →
Does the comparison prove the change caused success?

No. A before-and-after comparison alone does not prove causality. Other influences may occur simultaneously. The report makes known confounding factors and data gaps visible rather than attributing every change to the latest action.

What do I need before commissioning?

A documented change with its date, a usable baseline and comparable data for two agreed periods are needed. Describe known campaigns, measurement gaps or further changes. Credentials must not go in the enquiry form.

Isn't this already included in the quarterly review?

A quarterly review may already cover the same change and period. In that case, scope is reconciled beforehand. Impact analysis is intended for a separately defined investigation, not charging twice for the same comparison.

Can I use data from PostHog?

The basis is one analytics property or agreed data export. Describe your tool, available metrics and documented change in the enquiry. Before commissioning, we clarify whether the data can be analysed appropriately. A new PostHog integration is not automatically set up.

Which periods are included?

Two comparison periods of no more than eight weeks each are included. Suitable periods depend on the documented change and data baseline. Arbitrarily selecting periods because they show a favourable difference would not provide reliable evidence.

Is an A/B test set up directly?

No. A recommendation for the next test is part of the report; technical implementation is not. The package includes neither an experimentation platform nor tracking repair. Actual testing requires separate clarification of the question, technical requirements and scope.

What happens if data is missing?

Analysis limitations are documented. Missing values are not guessed to report success anyway. A sensible next step may be clarifying measurement or making a suitable comparison later rather than deciding on a change without evidence.

When does work begin?

The data baseline, comparison periods and work window are confirmed before commissioning.

Which access is needed?

A usable baseline and documented change date Comparable data for the two agreed periods Known additional changes, campaigns or measurement gaps described where available Credentials must not be included in the enquiry. Details are agreed only after written commissioning.

What happens after handover?

One written follow-up round is included. The service scope lists the analyses, designs or technical changes covered by the package. We agree additional work with you before it begins.

Read more on this topic

Is better analytics worthwhile? Calculating reporting effort

How much time does your monthly report take? Include checking, setup and tool costs, and clarify conflicting figures before the next dashboard.

Read the guide ↗
Before you decide

What would need to add up for you?

Additional orders, relevant enquiries or less manual work: compare your assumptions with analysis and implementation costs.

Calculate your own scenario
Related services

These may fit too.

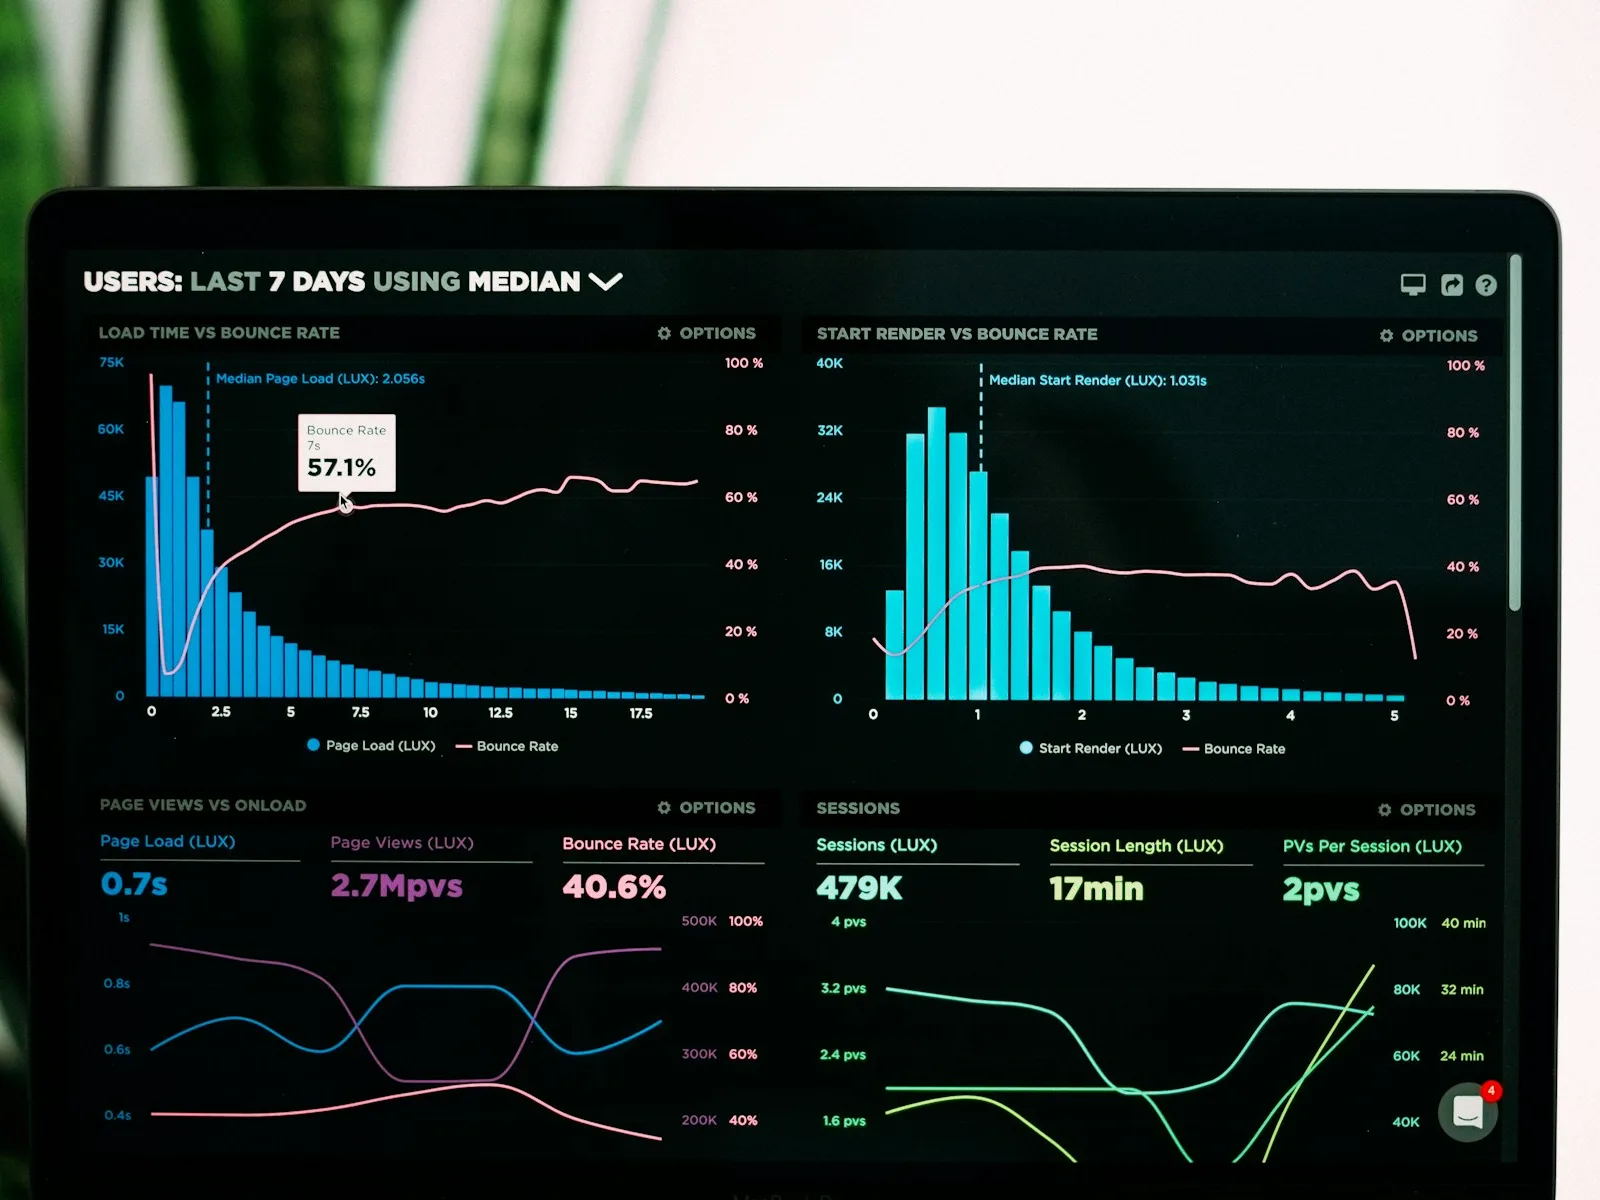
A screen displaying time series, distributions and other analytics metrics.
Offer
Analysis

Analytics data check

Which events does your tracking actually count? We check one analytics property for gaps and conflicting figures.

US$799.00Regular catalogue price US$899.00
Total price · one-off
VAT-exempt under section 19 of the German VAT Act
View details
Add to selectionOne of each service per project. No automatic commitment.
SaveCompare
Ask an expert