Suppose your website is reachable, but new enquiries have stopped arriving in the administration area since the last update. Visitors see an apparently successful interaction while your team waits for responses. This is where the purpose of monitoring becomes clear: it needs to make the workflows people depend on visible.
Server metrics, availability checks and error reports provide different perspectives. Connecting them to clear responsibilities turns measurements into manageable operational work. Your team can understand which task is affected, how urgent the report is and who takes the next step.
Decide which interruption your team needs to notice first
For a company website, the enquiry form and appointment booking may be particularly important. For an internal application, opening and saving records might matter most. An editorial platform also needs a functioning publishing process. Use these tasks to choose the checks rather than starting with a long list of every available server metric.
Describe how a problem would become apparent. Sign-in might fail, an enquiry might remain in processing for an unusual length of time, or a scheduled data transfer might stop producing a current result. These descriptions explain why a check exists and help the team interpret its messages later.
Check availability and observe the application itself
An external uptime check requests the website from another environment and tests whether the expected response arrives. This helps reveal DNS, certificate or connectivity problems that an internal check may not encounter through the same route. The expected content or status should suit the page being checked.
Inside the application, a health check can establish whether a service can perform its basic task. Docker Compose documents health checks as configurable tests of a service. An enquiry journey can additionally use a focused functional check that follows storage and processing with suitable test data. This examines both the service and the workflow people actually use.
CPU, memory and storage become useful in context
High CPU usage might belong to a planned import or coincide with slow responses. Memory use is also easier to interpret when the usual pattern and system limits are known. An investigation therefore considers timing, duration and the affected application alongside the observed impact.
For container applications, docker stats gives a current view of resources such as CPU and memory. Recorded trends support ongoing observation because a problem can be investigated after it has happened. Growing data directories also deserve attention: identifying storage needs early is easier to plan around than an interrupted write operation on a full disk.
An alert should lead to an understandable action
If every brief deviation produces the same urgent message, sorting important reports becomes another daily job. Alerting needs an agreed meaning: which task is affected, how long has the problem lasted and what response is expected? A focused set of rules supports handling more effectively than activating as many alarms as possible.
The Prometheus alerting guidance focuses on effects that matter to users and messages someone can act on. For a missed data transfer, that might mean looking at how current the result is. The alert should reach the person who can investigate a late run and, where appropriate, start it again.
A useful message identifies the service, time and a link to the relevant trend or record. Appropriate grouping and ownership prevent several symptoms of one event from being handled as unrelated incidents. Prometheus Alertmanager supports notification grouping and routing for this purpose.
Connect monitoring with the maintenance workflow
Monitoring makes a change visible; maintenance organises what happens next. After a relevant alert, the first task is to determine which part of the application is affected and what changed since the last working state. A released version, an update time and a brief change note make that investigation easier.
Before a planned update, agree which tasks will be checked afterwards. In the example application, that would include signing in, creating an enquiry and reopening the saved record. If the change also affects data, the return path needs planning. Operational support therefore connects observation, assessment and agreed changes in a way the team can follow.
Include backups and background processing
A successful page request says little about whether the latest backup or an overnight export ran. These tasks need their own expectations for time and result. Monitoring can identify, for example, that the last confirmed backup is older than expected and raise it for investigation.
Whether the saved state can actually be restored is examined in a restore rehearsal. The two perspectives complement each other: ongoing monitoring watches agreed processes, while the restore test examines a practical restart. This gives you a way to adapt checks as the system changes.
Agree on ownership and the response path
Setting up monitoring should establish where a message is sent and who handles it at which times. This includes contacting hosting providers or other suppliers. When several people are involved, a clear connection between the application, responsible person and record of the work helps everyone follow the response.
Initial setup and ongoing support are different service scopes. In either case, you need to know which checks are included, how changes are added and how the team sees the current status. Arad is responsible for system administration and system integration at SAND & MEHR and can discuss how these tasks fit your operation.
Start with an important workflow and build on it
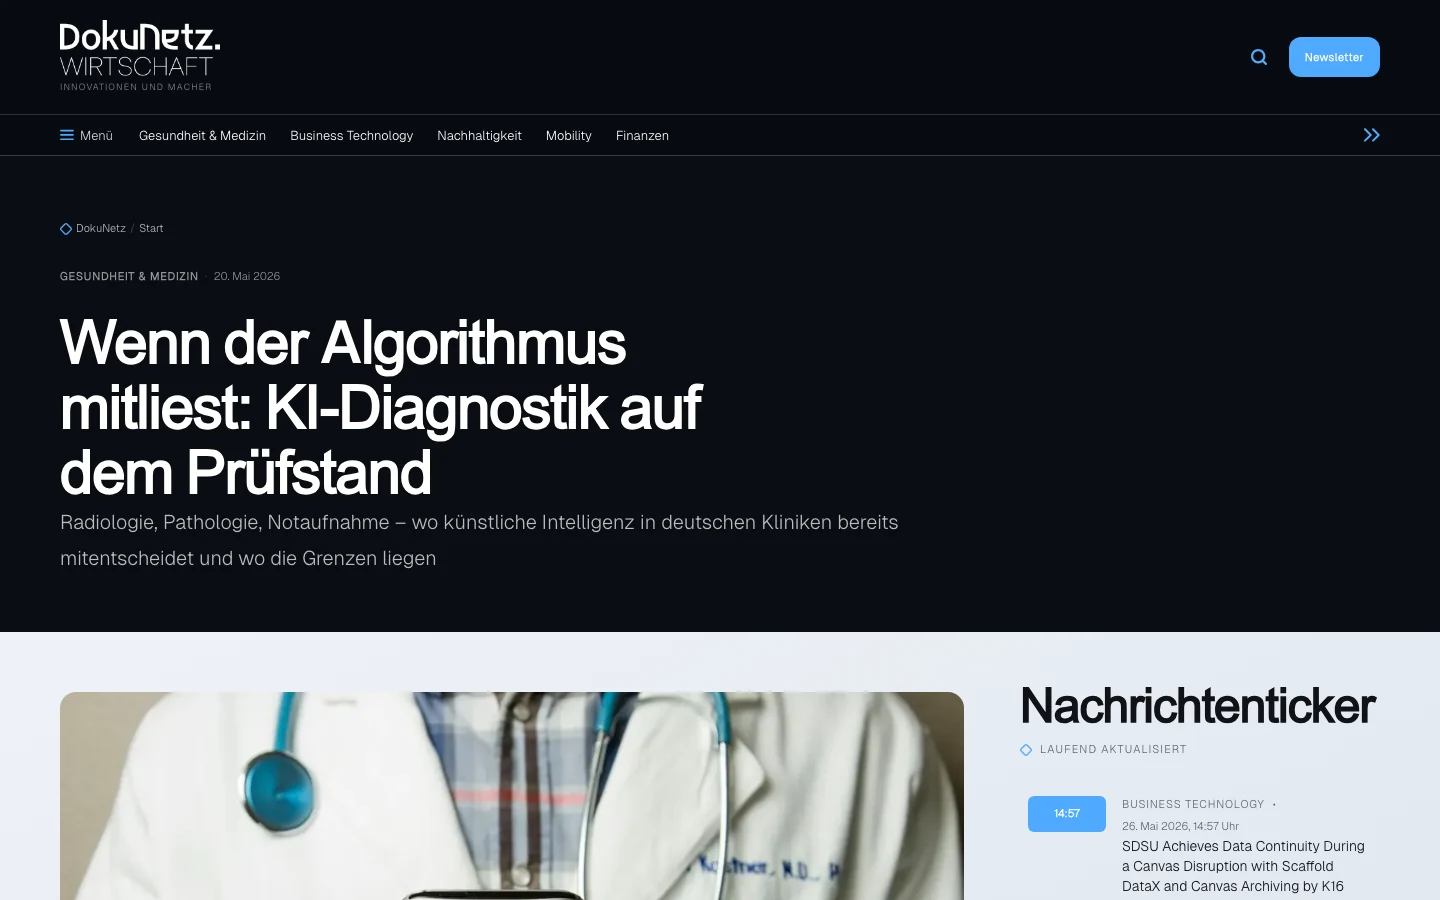
In Bridagency, a multi-step planner leads through to an enquiry, while DokuNetz Wirtschaft connects editorial work with public article pages. The projects show different journeys for which focused functional checks can be defined. Their case studies show how we designed and developed those journeys.
Our server monitoring setup starts with CPU, RAM and disk-space monitoring on one host, up to three HTTP or container checks and up to five alert rules connected to one email channel. Those checks provide a defined foundation for the workflow discussed here, while more detailed application questions can be planned around the signals already available. Technical operational support is a potential next step for regular checks and agreed maintenance. Our system integration landing page and relevant service category explain how this connects with integrations, provisioning and recovery.